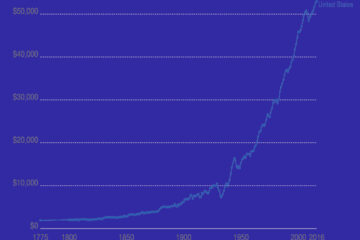
The Dow Jones Industrial Average (DJIA) is one of the oldest and most widely recognized stock market indices in the world. Since its launch in 1896, it has served as a barometer for the overall performance of the U.S. stock market, particularly the industrial sector.
Recent Performance:
Here are the closing values of the Dow Jones Industrial Average (DJIA) from 2010 to 2022:
2010: 11,577.51
2011: 12,217.56
2012: 13,104.14
2013: 16,576.66
2014: 17,823.07
2015: 17,425.03
2016: 19,762.60
2017: 24,719.22
2018: 23,327.46
2019: 28,538.44
2020: 30,606.48
2021: 36,338.30
2022: 33,224.50
BACKGROUND
The Dow Jones Industrial Average (DJIA), one of the most iconic stock market indices globally, was born in 1896. Its creators, Charles Dow and Edward Jones, aimed to provide a clear snapshot of the industrial sector’s performance in the United States. Starting with just 12 companies, the DJIA was an innovative approach to gauging the market’s overall health.
Early Years: Reflecting a Growing Economy
In its early years, the DJIA reflected the rapid industrial growth of the U.S. economy. It tracked the performance of industrial giants, primarily representing the steel, rail, and manufacturing sectors. The index offered investors a simplified view of the market, which was particularly valuable in an era without the advanced data analysis tools we have today.
The 20th Century: Wars, Booms, and Crashes
The 20th century was a period of significant upheaval and growth, mirrored in the DJIA’s performance. The index weathered numerous storms, including the Great Depression in 1929, where it saw a catastrophic drop, losing almost 90% of its value. However, it also captured the economic booms, particularly during the post-World War II era, as the U.S. economy expanded rapidly.
Expansion and Diversification
Originally focused on industrial stocks, the DJIA evolved over the decades to include companies from a broad range of sectors, reflecting the changing face of the American economy. This diversification was crucial as it meant the DJIA could offer a more accurate representation of the entire economy, not just industrial stocks.
The Late 20th Century: Technological Revolution
The late 20th century brought about the technological revolution, significantly impacting the DJIA. The rise of tech companies transformed the composition of the index, and this sector’s growth led to substantial increases in the DJIA’s value, especially during the 1990s.
The 21st Century: Resilience Amid Challenges
The early 2000s were marked by the dot-com bubble burst and the 2008 financial crisis, both leading to significant drops in the DJIA. However, the index demonstrated remarkable resilience, recovering to new highs each time. This recovery was driven by the strength of the technology sector, among others, and supported by monetary policies and global economic trends.
The 2020s: A New Era of Challenges and Opportunities
Entering the 2020s, the DJIA faced the unprecedented challenge of the COVID-19 pandemic, which caused a sharp, albeit brief, market downturn. However, it rebounded quickly, reflecting the market’s adaptability and the growing influence of digital and healthcare sectors. As of 2023, the DJIA continues to be a vital indicator of the U.S. economy’s health, adapting to the latest economic and technological trends.
From its inception in 1896 to 2023, the DJIA has not just mirrored the U.S. economy’s growth but has also adapted to its transformations. This journey reflects the dynamism of the American market and economy, showcasing its ability to overcome challenges and seize new opportunities. As we move forward, the DJIA remains a critical gauge of economic performance and a symbol of the enduring spirit of American enterprise.

